September 26, 2023

Vegas and Phoenix Cross Market Insights Report - September 2023

September 26, 2023
Vegas and Phoenix Cross Market Insights Report - September 2023

We recently released our latest Market Insights report for the Vegas and Phoenix markets for September 2023. Here is a high level overview of our findings.

  • From Q4 2022 to Q3 2023, active listings saw a sharp decline in both Vegas and Phoenix. However, there was a noticeable uptick in active listings last month. Additionally, both markets experienced an increase in new listings during the same period, even as closings fluctuate on a monthly basis.
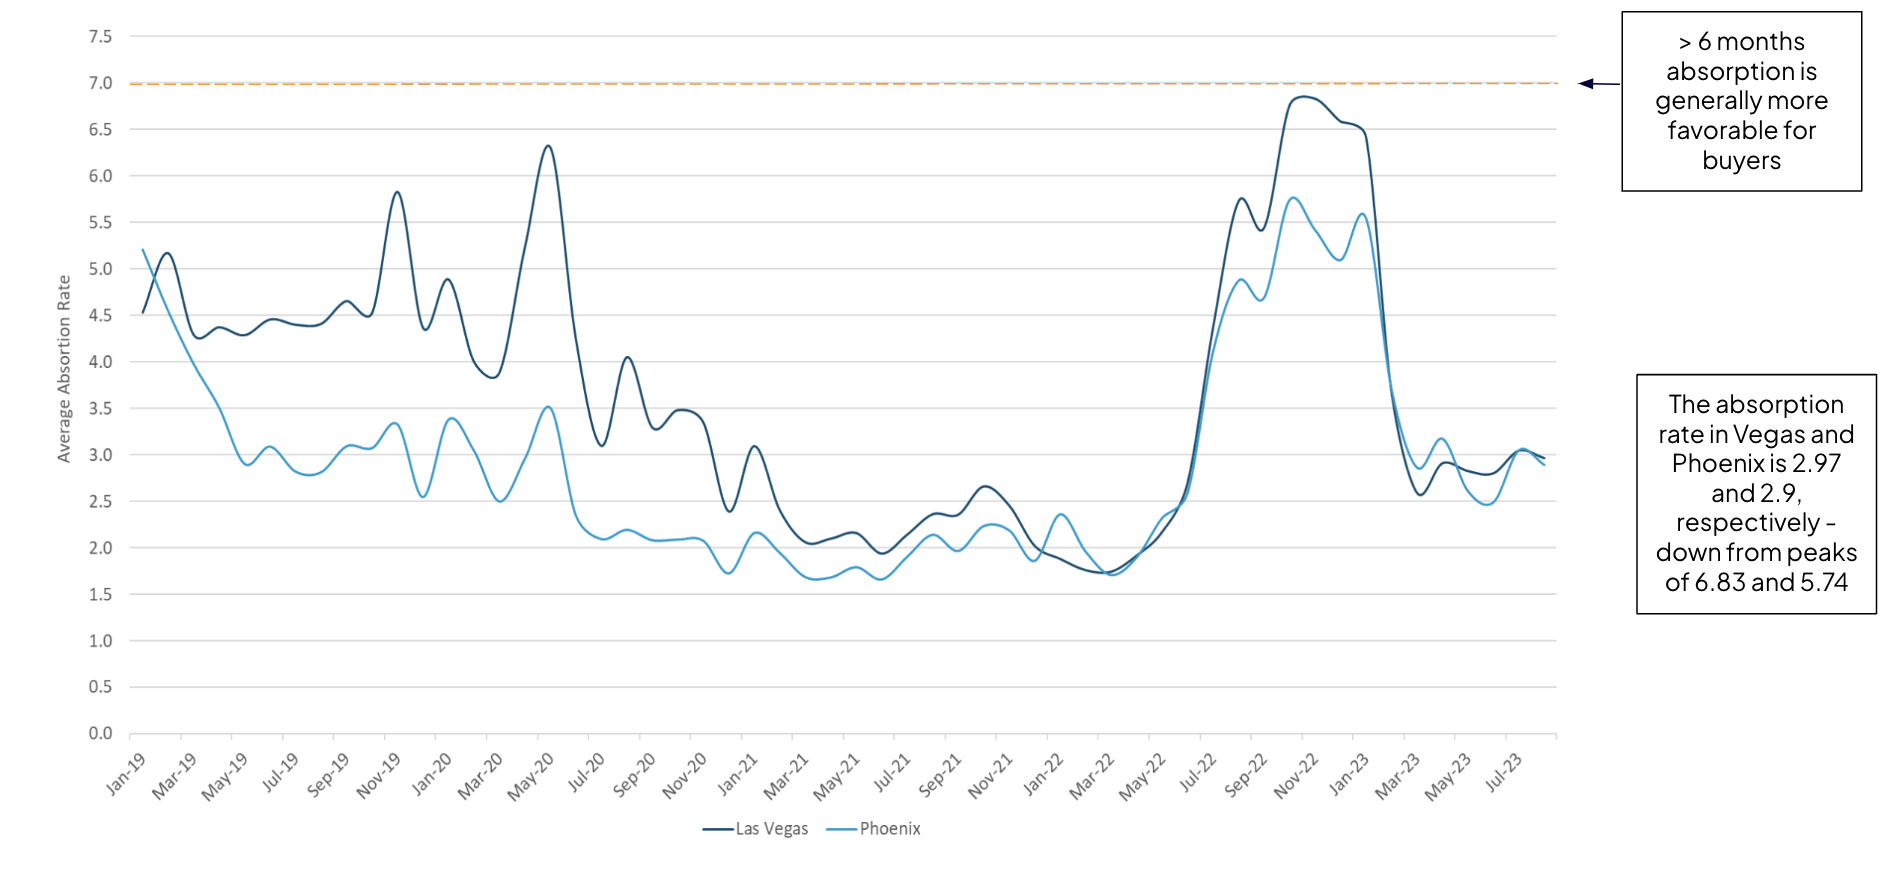
  • Absorption rates have seen significant declines from their peaks in late 2022 and early 2023. Currently, the absorption rates stand at 2.97 months in Vegas and 2.9 months in Phoenix.
  • Since peaking in May 2022, institutional-grade home prices have dropped by nearly 5% in Vegas and 4% in Phoenix.
  • In Q4 2022, approximately 80% of all properties in Las Vegas and Phoenix had been on the market for over 60 days. Presently, properties with 60+ DOM make up just 43% in Vegas and 41% in Phoenix.
  • After reaching a low in Q4 2022, the sale-to-original-list pricing in both Vegas and Phoenix has rebounded to 98%.
  • Average list prices and sale prices p.s.f have converged in both both markets. In Vegas, this convergence is attributed to rising average sale prices p.s.f., whereas in Phoenix, it's because of a decline in average list prices p.s.f.
  • Amid rising mortgage rates, these two MSAs continue to rank among the least affordable in the nation.

After a sharp drop in active listings from Q4 2022 to Q2 2023, there was a slight uptick last month. Closings have consistently decreased since February, but new listings increased by 21% in the past month.

Similar to Vegas, Phoenix saw an increase in active listings last month after a consistent decline over the previous ten months. While the volume of new listings has remained steady, closings experienced their first uptick since May.

Absorption Rate Comparison - Las Vegas and Phoenix

Average purchase prices have been rising each month since April, but declined last month. Today's average home prices are roughly on par with those at the end of Q3 2022. Year-to-date, prices have increased by 2%.

Both list prices and sale prices p.s.f. have risen consistently since March. During this period, the difference between average sale and list prices p.s.f has diminished. However, current p.s.f is still below the peak observed in 2022.

For now, average purchase prices in Phoenix have stabilized. Year-to-date, prices have decreased by only 0.2%. Current pricing in Phoenix mirrors levels last seen in November 2022.

For the first time since June 2022, average p.s.f have risen. Similar to Vegas, average sales prices p.s.f have been gradually rising since the beginning of the year, narrowing the gap between list and sale prices p.s.f.

After hitting a trough in December of 2022, STOLS have converged to 98% in both markets.

The affordability gap is especially high in Las Vegas, where average pricing remains 65% higher than affordable levels.

Interested in learning more about Entera and our Market Insights reports?

Click here to request a consultation with our experts.